The Reports page turns what you have been doing all month into numbers you can act on: which services earn, which crews are productive, how many of your estimates turn into work, and who has not paid.
Running one
- Go to Reports.
- Choose the report you want.
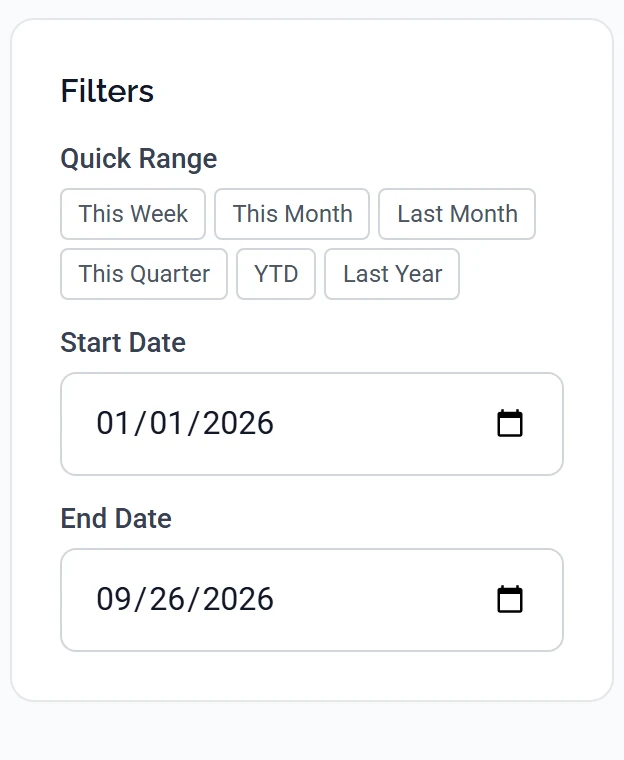
- Set the date range. Most questions are month-on-month, so start there.
- Read the table, or switch to a chart where one is offered.
Charts
Reports that suit a picture offer a chart toggle for bar, line or pie, depending on what the numbers are.

- Bar compares things side by side. Revenue by service, hours by employee.
- Line shows a direction over time. Whether this month is better than last.
- Pie shows shares of a whole. What proportion of your estimates get accepted.
Reports about your customers
Reports ranked by customer (your best customers, who owes you money) show the top of the list by default, because on a long list the first few are usually the answer. Where that applies you can choose how many to include, up to all of them.
Check the count before you read too much into a ranking. A report showing your top 10 is answering “who are my biggest customers”, not “how much did I earn”. Switch it to all if you want the total.
Exporting
Every report exports to CSV, which opens in Excel, Numbers or Google Sheets. Pick a report first, then use Export CSV at the top of the page, beside the Reports heading. The button only appears once a report is selected, so if you cannot see it, choose a report.

The export deliberately contains more than the screen does. Internal record IDs are included even though they are hidden on screen. They are there so a spreadsheet can be matched back against your data or against QuickBooks, and so your accountant can join two exports together without guessing.
If the numbers look wrong
Three things account for nearly every “that cannot be right”:
- The date range. Most surprises are a range that does not cover what you think it does. Check it first.
- Status, not date. Revenue reports count invoices in a state (sent, paid), so a job finished but not yet invoiced is genuinely not in there.
- Where the work was recorded. Hours only appear if they were clocked. A crew that writes times on paper is invisible to a productivity report.
Everything failing at once is a session problem, not a reports problem. If reports return an authentication error and other pages are also misbehaving, sign out and sign back in. That is almost always a stale browser session, most often after a password change.
Common questions
Can I schedule a report to email itself to me?
Not yet. Run it and export it for now.
Do reports include estimates that were never accepted?
Only where that is the point of the report. The conversion report needs them. Revenue reports are built from invoices, so a declined estimate does not inflate your income.
Can employees see reports?
Not by default. Reports are owner and admin. You can grant an individual employee access from their profile under Team.
Why is a report empty?
Usually a date range with nothing in it, or a filter left set from last time. Widen the range to a full year and see whether anything appears.